Normalized Benchmarking
Normalized Benchmarking is a method to compare portfolios with differing equity and fixed income allocations.
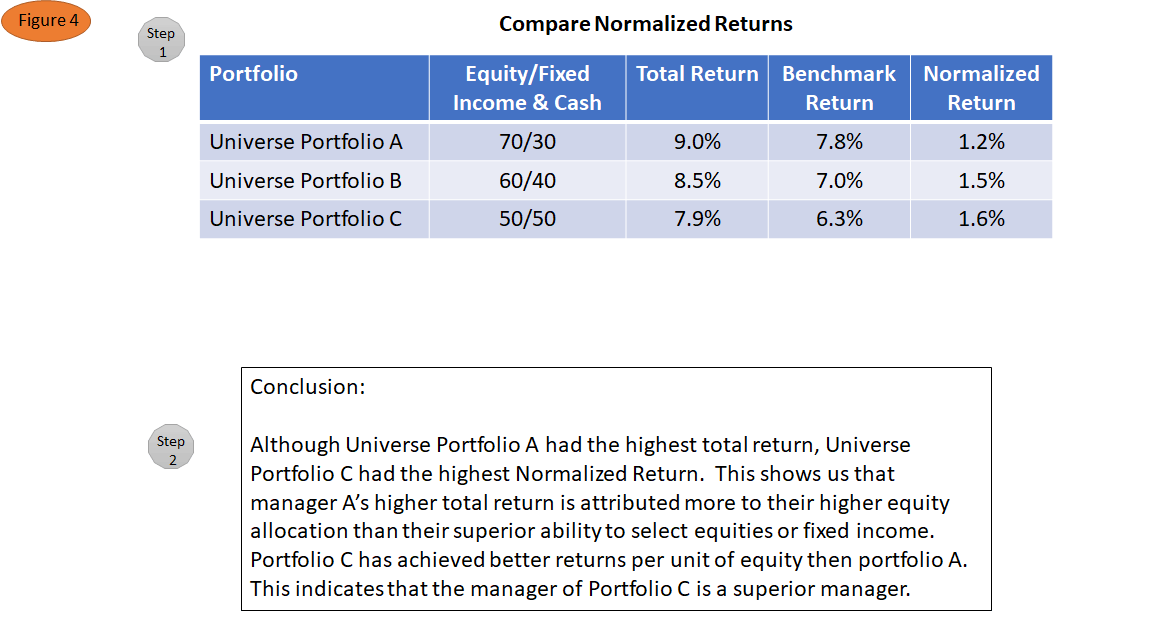
The percentage allocated to equities in a portfolio is one of the largest drivers of returns. Because of this, comparing two portfolios that have a different level of equity allocation is difficult and can be misleading.
Normalized Benchmarking controls for differences in equity holdings by adjusting the benchmark to match the equity/fixed income ratio of the portfolio.
When this is done across a group of portfolios, the portfolios can then be measured against each other by their return above or below the benchmark specific to the portfolio. Below is a more detailed explanation of how the benchmark is constructed and used.
To begin, one must define the universe of portfolios that will be analyzed. For our purposes, we analyzed taxable accounts at robo advisors as one universe, and retirement accounts at robo advisors as a separate universe.
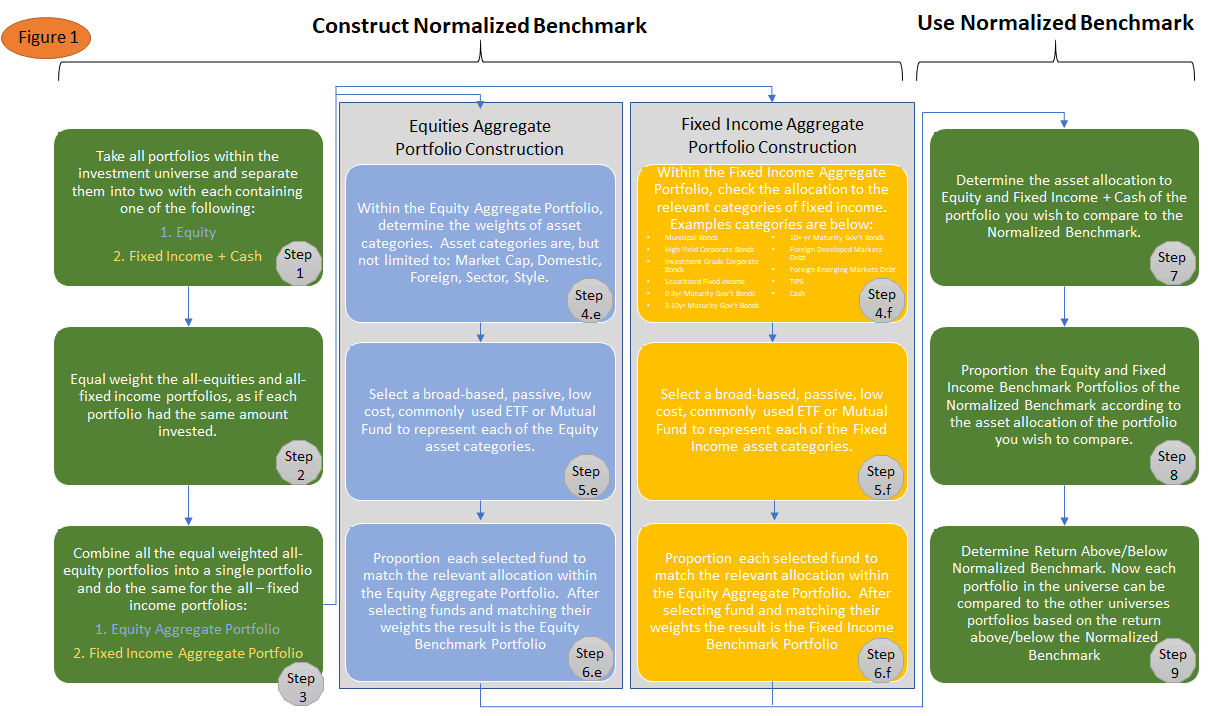
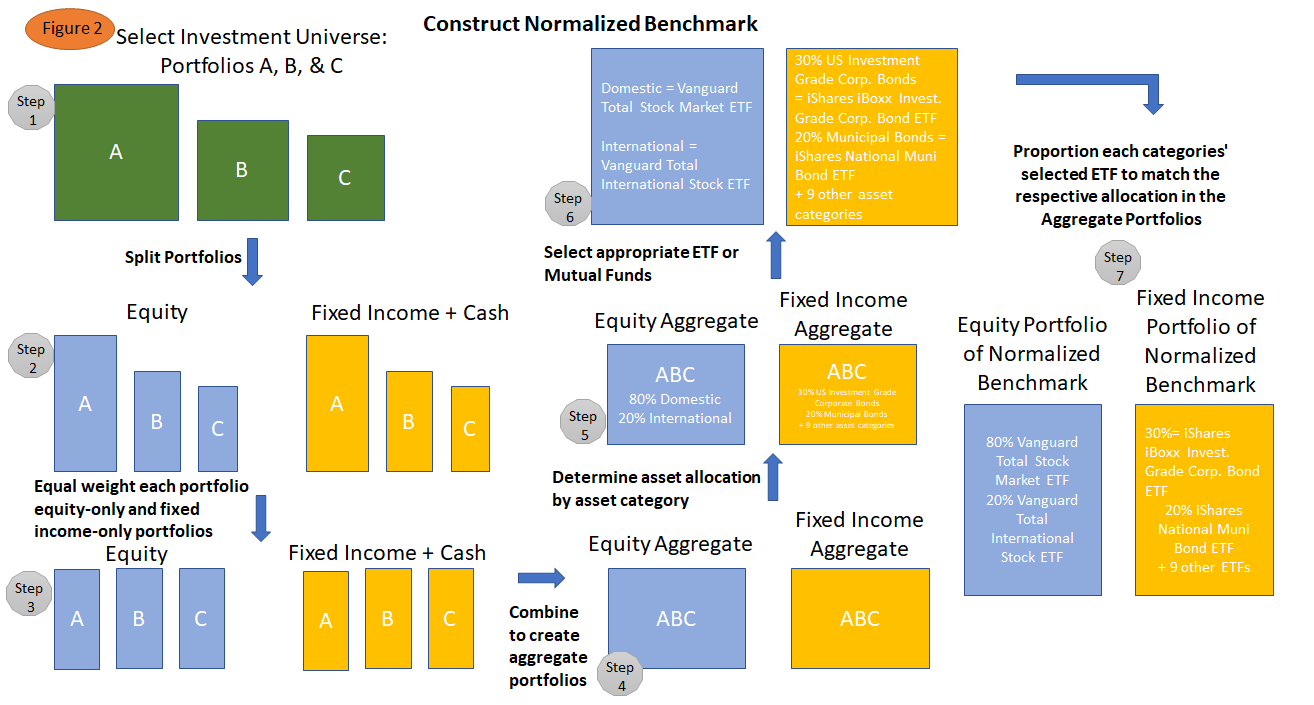
To construct the Normalized Benchmark, each portfolio within the investment universe must be separated into a portfolio of equity holdings and a portfolio of fixed income holdings (cash is included with the fixed income). This means that for each robo portfolio in a universe, we now have two portfolios, one made up of fixed income and one made up of equities. We then take all of the equity portfolios, equal weight them, and make them into one Equity Aggregate Portfolio. This portfolio contains a piece of every fund held in each equity portion of the portfolios. The same is done for fixed income.
After this step is completed, each aggregate portfolio is analyzed to determine the type and weight of assets held in each. The Equity Aggregate Portfolio is analyzed to determine the allocation of the portfolio to domestic equities and the allocation to international equities. For the Fixed Income Aggregate Portfolio, allocations to the following categories are determined: municipal bonds, investment-grade corporate bonds, high-yield corporate bonds, foreign emerging markets debt, foreign developed markets debt, TIPS, short-term treasuries (0-3 year maturities), mid-term treasuries (3-10 year maturities), long-term treasuries (maturities of 10 years or greater), multi-sector bond funds, and cash.
Next, we select a broad-based, passive, low-cost, commonly used ETF to represent each asset type. For example, the Vanguard Total Stock Market and Vanguard Total International Stock Market ETFs are used for the domestic and international positions in the equity benchmark portfolio, respectively. These are widely used, highly liquid, low-cost ETFs that are representative of the type of asset to which they are assigned.
We then match the weight of the selected ETFs to the allocation of the corresponding asset types within its respective aggregate portfolio. For example, the amount of the Vanguard Total Stock Market ETF in the Equity Portfolio of the Normalized Benchmark matches the weight of domestic stocks in the Equity Aggregate Portfolio. This creates the Equity and Fixed Income Portfolios of the Normalized Benchmark that represent the robo portfolios’ equity and fixed income holdings, respectively.
Now that we have constructed the Equity and Fixed Income Normalized Benchmark Portfolios, we can use it to compare performance across accounts within the previously determined investment universes. In current reports, the equity/ fixed income mix of a portfolio’s benchmark is updated according to the equity allocation of the portfolio at the end of each calendar year. Alternatives, including commodities, allocations are handled by proportionally splitting the alternatives allocation into equity and fixed income when calculating the benchmark weights.
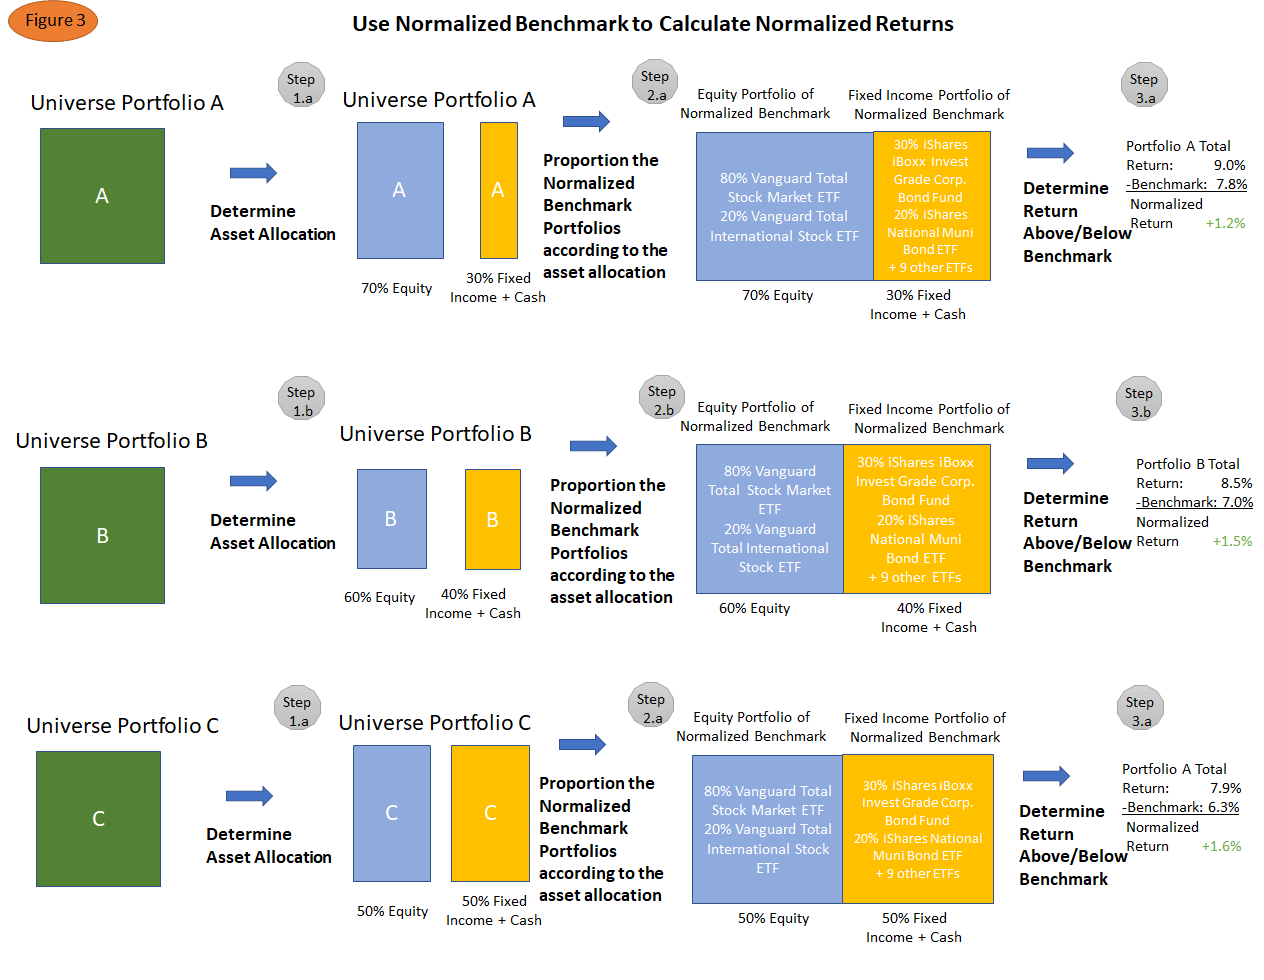
For example, if we are measuring a portfolio with 60% equities and 40% bonds and cash, we create a benchmark that is made up of 60% of the equity benchmark and 40% of the fixed income benchmark. If we are measuring a portfolio with 65% equities and 35% fixed income, a benchmark is created, again using the Equity and Fixed Income Portfolios of the Normalized Benchmark, but in a 65% to 35% proportion.
The Equity and Fixed Income Portfolios of the Normalized Benchmark are consistent, holding the same funds, in the same weights, regardless of the account you wish to compare, but the proportion of all of the equities and all of the fixed income changes to match the target allocation of the portfolio we are comparing. Therefore, a 65/35 portfolio is measured against a 65/35 benchmark, and a 70/30 portfolio is measured against a 70/30 benchmark. Each of the underlying equity and fixed income assets of the benchmark are consistent in each case, but the amount of the benchmark that is fixed income or equities changes to match the portfolio.
After benchmarks are created, we introduce a 0.30% annual management fee to make the benchmark comparable to the fee charged by the most prominent robo advisors.
Portfolios can then be measured based on their returns above or below the Normalized Benchmark. These returns for each portfolio above or below the Normalized Benchmark can then be compared to each other. This gives the investor a good idea of how the portfolios are performing, regardless of how much is in equities and how much is in fixed income.